Most founders build too much before they learn anything. They spend a year and a budget on a fully-featured product, launch it, and discover the market never wanted it. The minimum viable product approach exists to prevent exactly that outcome, and the MVP statistics in this article show, in hard numbers, why it works.
This matters for founders, product managers, and enterprise teams alike. An MVP is not a cheaper, lower-quality product. It is the fastest way to test your single most important business assumption with real users before you over-invest. The data behind that idea is now substantial.
This article pulls together the most useful MVP statistics from verified sources, covering adoption, cost savings, success rates, the reasons products fail, development timelines, and what the numbers actually mean for your next build. Every figure links to its source so you can verify it yourself.
MVP Adoption Statistics: How Widely the Approach Is Used
Before looking at outcomes, it helps to see how mainstream the MVP approach has become. These MVP statistics show that building lean is now the default, not the exception.
- Approximately 72% of startups use an MVP approach to get feedback and refine their product, according to SDH Global.|
- 91.3% of businesses surveyed have already launched a product using an MVP approach, per a GoodFirms survey of 680 businesses conducted in September 2024.
- 84.3% of participants believe MVPs are beneficial for large organizations, not just startups, the same GoodFirms study found.
- By 2025, Gartner estimated 70% of new enterprise applications would use no-code or low-code technologies, a shift that makes MVPs faster to build, as cited by DevsData.
The takeaway is simple. The MVP is no longer a startup-only tactic. Large organizations have adopted it as a standard method for validating ideas before committing full budgets.
Why Businesses Use MVPs: The Benefits in Numbers
These MVP statistics break down the specific reasons teams choose to build lean, drawn largely from the GoodFirms survey of businesses that have shipped an MVP.
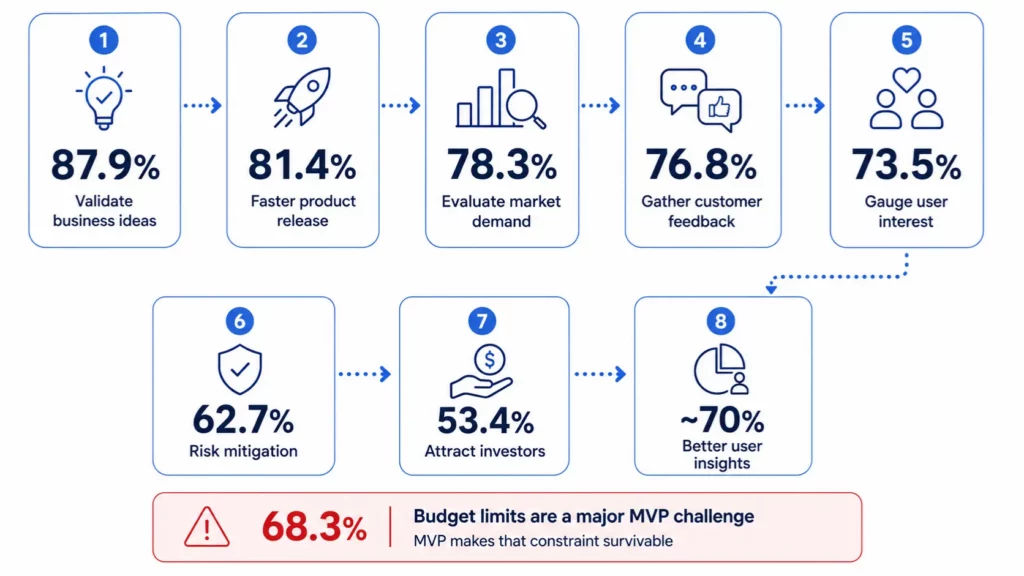
- 87.9% of businesses agree that an MVP helps validate business ideas, according to GoodFirms.
- 81.4% cite faster product release as a key benefit of building an MVP.
- 78.3% use an MVP to evaluate market demand, and 76.8% use it to gather valuable customer feedback.
- 73.5% believe an MVP helps gauge user interest, while 62.7% use it specifically for risk mitigation.
- 53.4% use an MVP as a tool to attract investors, showing the approach has financing value as well as product value.
- Around 70% of companies using an MVP get better user insights (Gartner, cited by SDH Global).
Notice that a single budget constraint also appears in the data: 68.3% of businesses identified budget limits as a major challenge in MVP development, per the same GoodFirms research. The MVP exists partly to make that constraint survivable.
MVP Cost and Speed Statistics
- One of the strongest arguments for building lean is financial. These MVP statistics quantify how much cheaper and faster the approach is than full product development, and they line up closely with real-world MVP cost breakdowns.
- MVPs can lower development costs by up to 60% compared to traditional product development, per SDH Global.
- Building an MVP typically costs just 10 to 30% of what a full product would cost, according to American Chase.
- MVP development costs are typically 50 to 70% lower than full product development, per RSVR Tech.
- SaaS MVP development can reduce upfront costs by 30 to 50%, according to EnactOn.
- Startups using the MVP approach get to market about 35% faster than those using traditional methods, per SDH Global.
- Most MVPs take 8 to 16 weeks from concept to launch, according to Codevelo.
- On average it takes four months to build an MVP, with three months being the most common timeline, based on Altar.io data.
- No-code MVP builders save 60 to 80% on initial costs and launch 3 to 5 times faster than custom-coded solutions, per Kissflow.
MVP Success Rate Statistics
The cost savings would not matter if MVPs did not improve outcomes. These MVP statistics show a measurable link between the approach and product success.
- Startups that begin with an MVP are 70% more likely to succeed than those that do not, according to Zackriya.
- The MVP approach delivers a 60% higher success rate than launching with a fully-featured product, per Startup Genome 2024 data cited by American Chase.
- 67% of startups attribute their success to the strategic use of MVP development, according to RSVR Tech.
- Startups using MVPs to test pricing and value propositions are about 50% more likely to achieve sustainable revenue models, per SDH Global.
- Startups using MVPs run 30% more product iterations than those using traditional methods, the same SDH Global analysis found.
MVPs and Fundraising Statistics
Investors respond to evidence. These MVP statistics show how an MVP plus traction changes the odds of raising money.
- Startups with MVPs and early user traction are 4 times more likely to receive funding, per Y Combinator data cited by American Chase.
- Startups showing an MVP plus one meaningful traction metric closed seed rounds at roughly 50% success in 2024, versus around 15% for idea-only pitches, according to EnactOn.
- Teams spending at least 20% of their MVP budget on the pre-development phase are 3 times more likely to build a successful product, per Startups.com data cited by American Chase.
Want these numbers working in your favor?
EnactOn helps founders scope, build, and launch MVPs that validate fast and attract investors, starting with a structured discovery session before any code is written.
Book a Free Discovery Session at enacton.com
Startup and Product Failure Statistics
The case for MVPs is strongest when you look at what happens without validation. These failure figures explain the risk the MVP approach is designed to reduce.
- 42% of startups fail because they build products the market does not need, according to CB Insights, whose updated 2026 report cites 43% for poor product-market fit.
- 90% of startups fail overall, with 70% failing during years two through five, per Founders Forum.
- 45 to 50% of startups cease to exist before or during their fifth year, according to Upsilon.
- 95% of newly launched products face failure, per Clayton Christensen of Harvard Business School, cited by MIT.
- Only 40% of developed products ever reach the market, and of those only 60% generate revenue, according to G2.
- Only 20% of new products survive longer than two years after launch, per G2.
- 38% of startups fail due to running out of capital, and 74% of high-growth internet startups fail from premature scaling (Startup Genome), per Eximius VC.
The Feature Bloat Problem: Why Lean Wins
MVPs work partly because most product features are wasted effort. These MVP statistics on feature usage make the case for building only what matters.
- 80% of features in the average software product are rarely or never used, according to Pendo.
- Only 12% of features generate 80% of daily usage volume in software products, the same Pendo report found.
- Publicly-traded cloud companies invested up to $29.5 billion developing features that are rarely or never used, per Pendo.
This is the entire argument for the MVP in three numbers. If most features go unused, building all of them before validation is a direct waste of capital. The MVP forces you to build the 12% that matters first.
Pivot and Product-Market Fit Statistics
Building an MVP is rarely a straight line. These MVP statistics show how often successful companies change direction and how product-market fit is measured.
- 92% of startups pivot at least once before finding product-market fit, per WinSavvy 2025 data cited by Startup Bricks.
- 75% of successful startups pivoted at least once before achieving success, according to the same WinSavvy research.
- Startups that pivot once or twice raise 2.5x more money and have 3.6x better user growth than those that pivot too many or too few times, per the Startup Genome Report.
- Product-market fit is signaled when at least 40% of users say they would be very disappointed if they could no longer use the product, per the Sean Ellis Test.
Agile vs Waterfall: Methodology Statistics
How you build affects whether the MVP succeeds. These MVP statistics compare iterative and traditional development.
- Agile projects have a 42% success rate versus only 13% for Waterfall, according to the Standish Group Chaos Report 2020, cited by Agile Genesis.
- Agile projects have an 11% failure rate versus 59% for Waterfall, per the same report.
- Agile projects are 28% more successful than traditional Waterfall projects, according to PwC 2017 data cited by Agile Genesis.
What These MVP Statistics Actually Mean
Numbers are only useful if they change what you do. Here is how to read the MVP statistics above as a set of decisions rather than trivia.
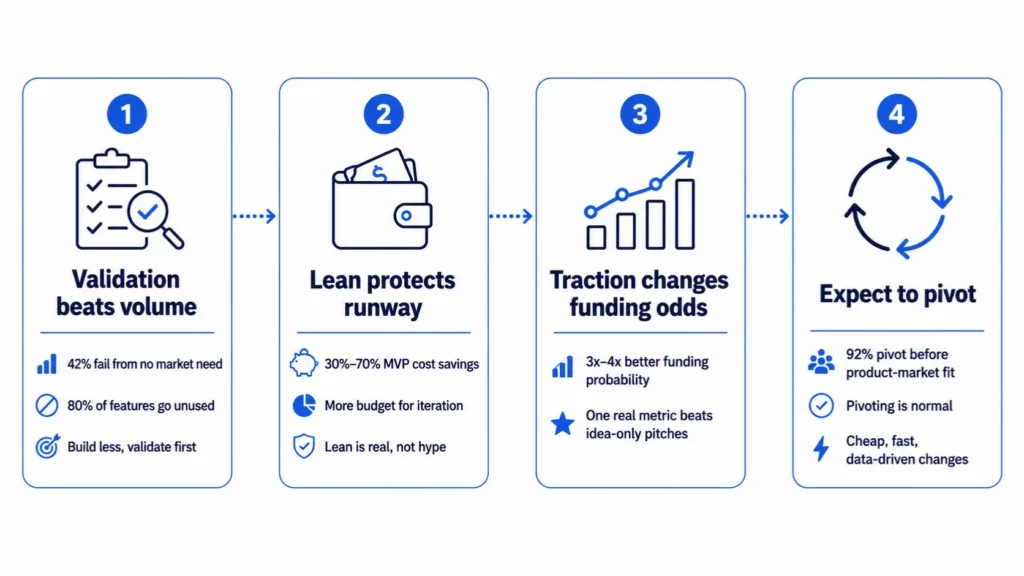
1. Validation beats volume
The failure data and the feature-usage data point to the same conclusion. With 42% of startups failing for lack of market need and 80% of features going unused, the biggest risk is not building too little. It is building too much of the wrong thing. The MVP statistics consistently reward teams that validate first.
2. The cost argument is real, not marketing
Multiple independent sources put MVP cost savings between 30% and 70%. When figures from different research groups cluster in the same range, the pattern is trustworthy. Building lean genuinely preserves the runway you will need for iteration after launch.
3. Traction changes your funding odds
The fundraising MVP statistics are some of the most actionable. An MVP with one real traction metric roughly triples to quadruples your funding probability versus an idea-only pitch. If you are raising, an MVP is not optional, it is the price of entry.
4. Expect to pivot
With 92% of startups pivoting before product-market fit, a pivot is not failure. It is the normal path. The MVP exists to make pivoting cheap, fast, and informed by real user data rather than guesswork.
How to Use MVP Statistics in Your Own Planning
These figures are most valuable when they shape your actual plan. A few practical ways to apply the MVP statistics above:
- Set your MVP budget at 10 to 30% of your full-product estimate, in line with the cost data, and reserve the remainder for post-launch iteration.
- Plan an 8 to 16 week timeline to first launch, matching the most common MVP development windows, and prepare a clear launch strategy before you ship.
- Define one traction metric before you build, because the funding data shows a single meaningful metric is what moves investors when you raise funding for your app.
- Apply the Sean Ellis 40% test after launch to measure product-market fit objectively rather than relying on optimism.
- Budget time for at least one pivot, since the overwhelming majority of successful startups changed direction before they found fit.
Conclusion
The MVP statistics gathered here tell one consistent story. Building lean lowers cost, speeds time to market, improves success rates, and dramatically increases the odds of raising money, while the alternative, building a full product before validation, carries failure rates that the data makes impossible to ignore. The smart move is to turn your idea into a lean, testable product first.
Use these numbers to make decisions, not just to feel informed. Scope your MVP tightly, define a traction metric, plan for a pivot, and measure product-market fit honestly. EnactOn has delivered 500+ projects across 65+ countries, helping founders build MVPs that validate fast and stand up to real users. If you are ready to put these MVP statistics to work, our team starts with a structured discovery session.
FAQs
What percentage of startups use an MVP approach?
Approximately 72% of startups use an MVP approach to refine their product, according to SDH Global, and a GoodFirms survey found that 91.3% of surveyed businesses have launched a product using an MVP. The approach has become the default method for validating ideas, and it is no longer limited to early-stage startups, with 84.3% of respondents saying MVPs benefit large organizations too.
How much does building an MVP save compared to a full product?
Independent sources place MVP cost savings between 30% and 70%. American Chase reports an MVP typically costs just 10 to 30% of a full product, RSVR Tech cites 50 to 70% lower costs, and SDH Global reports savings of up to 60%. No-code MVPs can save even more, with Kissflow citing 60 to 80% savings and 3 to 5 times faster launches.
Do MVPs actually improve a startup’s success rate?
Yes, according to multiple sources. Zackriya reports that startups beginning with an MVP are 70% more likely to succeed, and Startup Genome 2024 data cited by American Chase shows a 60% higher success rate than launching with a fully-featured product. RSVR Tech also found that 67% of startups attribute their success to strategic MVP development.
How long does it take to build an MVP?
Most MVPs take 8 to 16 weeks from concept to launch, according to Codevelo. Altar.io data puts the average at around four months, with three months being the most common timeline. Timelines depend heavily on scope, complexity, and whether the team uses no-code, low-code, or custom development.
Why do most startups and products fail?
The leading cause is building something the market does not need. CB Insights reports that 42% of startups fail for this reason, and its updated 2026 report cites 43% for poor product-market fit. Other major causes include running out of capital (38%) and premature scaling, which Startup Genome links to 74% of high-growth internet startup failures. The MVP approach is designed specifically to reduce the product-market fit risk.
How does an MVP help with fundraising?
An MVP with traction substantially improves funding odds. Y Combinator data cited by American Chase shows startups with MVPs and early user traction are 4 times more likely to receive funding. EnactOn reports that startups showing an MVP plus one meaningful traction metric closed seed rounds at roughly 50% success in 2024, compared with around 15% for idea-only pitches.
How is product-market fit measured after launching an MVP?
The most widely used method is the Sean Ellis Test, which signals product-market fit when at least 40% of users say they would be very disappointed if they could no longer use the product. Reaching that threshold is a strong indicator that the MVP has found genuine demand and is ready for scaling. Most startups pivot at least once, often more, before reaching this point.